LabVIEW Pressure Distribution Analysis with Load Cells
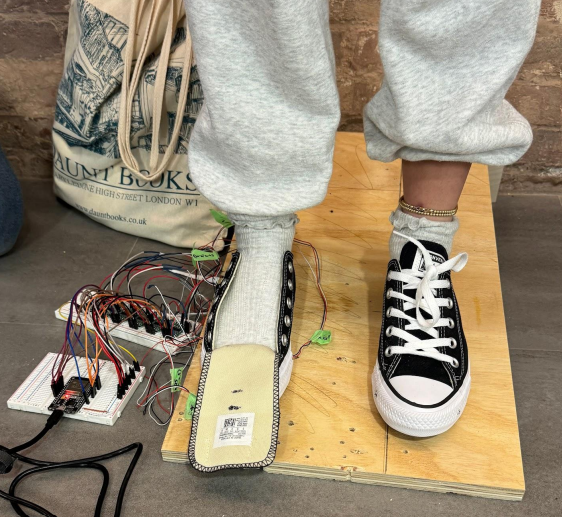
In the spring of 2024 I took ME70: Experiments/Instruments at Tufts. For our final project, my team (Tyler Mackowski, Carolyn Thompson, Madanna Vue, and I) built a foot pressure sensor out of an array of load cells and used it to see how pressure shifts around the foot when standing on an incline, a decline, and flat ground.
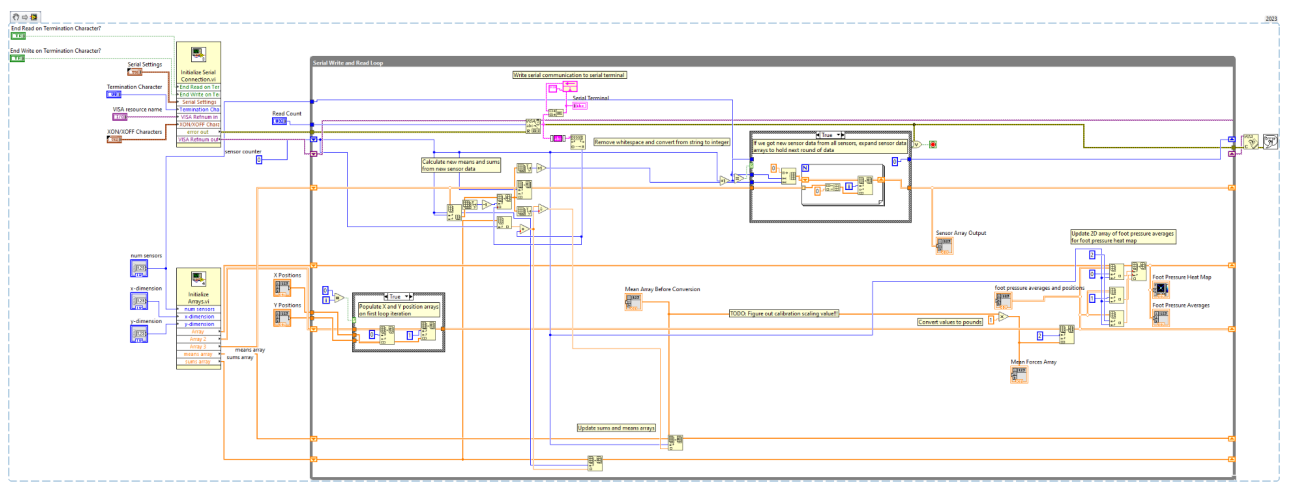
We wired six 50 kg load cells into the insole of a Converse sneaker — one at the big toe, one at the ball of the foot, one at the midfoot, and the rest around the heel. Each load cell works like a Wheatstone bridge, so its signal is too small to read directly — every sensor needed its own HX711 amplifier (a precision 24-bit ADC) to boost that signal before it reached the ESP32. The ESP32 itself didn't do much beyond reading the sensors and relaying the raw values out over serial — the real work happened on the LabVIEW side, which handled calibrating each sensor, converting readings into kilograms, and generating the pressure heat maps.
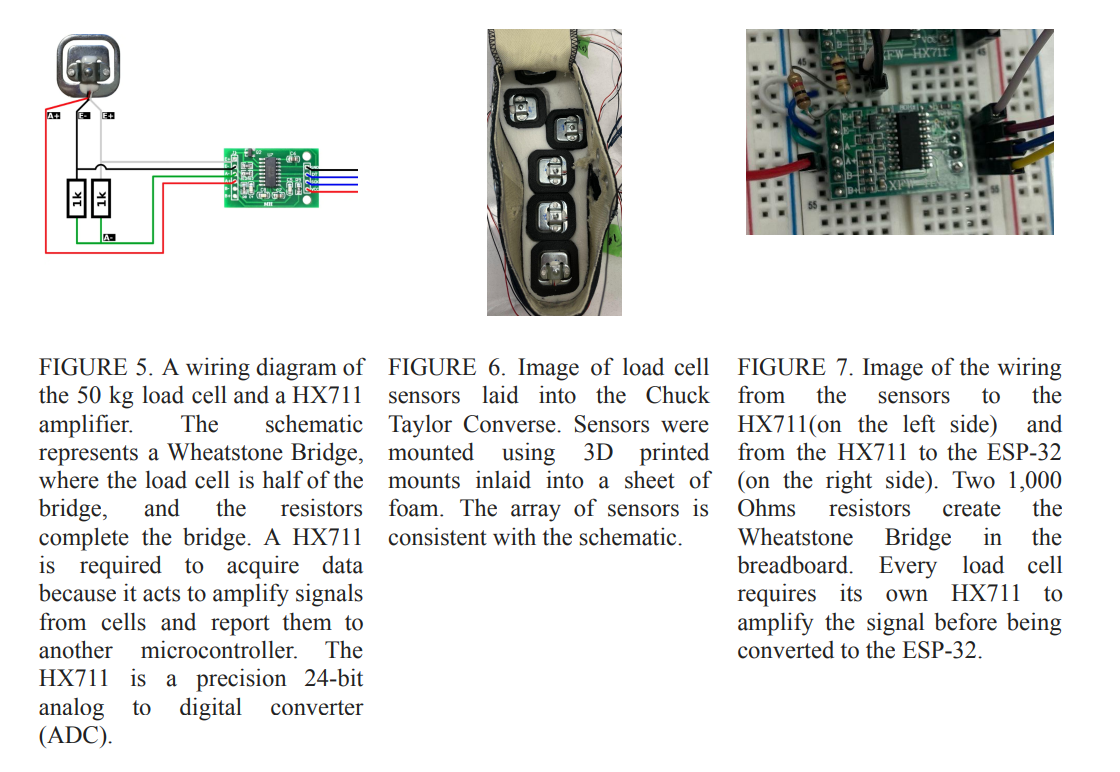
The LabVIEW Code:
I calibrated each load cell individually by feeding it known 1, 3, and 5 kg loads and fitting a line to convert its raw readings into kilograms, then wrote the LabVIEW program that reads all six sensors live, applies each one's calibration, and renders the result as a real-time foot pressure heat map.
Testing:
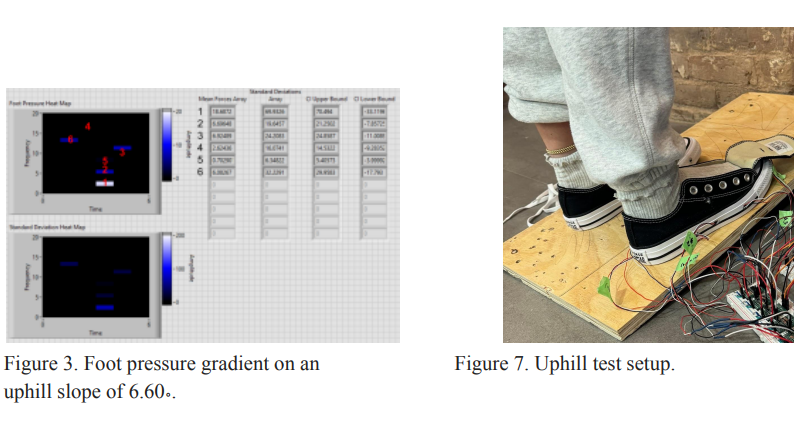
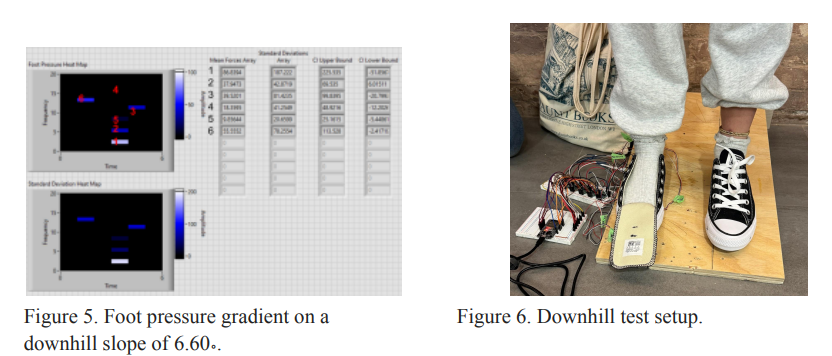
We tested three conditions — a 6.6° incline, a 6.6° decline, and flat ground — with someone standing still on the sensor for about 30-60 seconds each time.
Results:
Standing on the incline pushed most of the pressure into the heel. On the decline it shifted toward the front of the foot, though the heel stayed surprisingly loaded too. On flat ground it spread out more evenly, with a bit more weight in the midfoot. The data was noisier than I'd like, so I'd call these results suggestive rather than conclusive, but they lined up with what we expected going in.
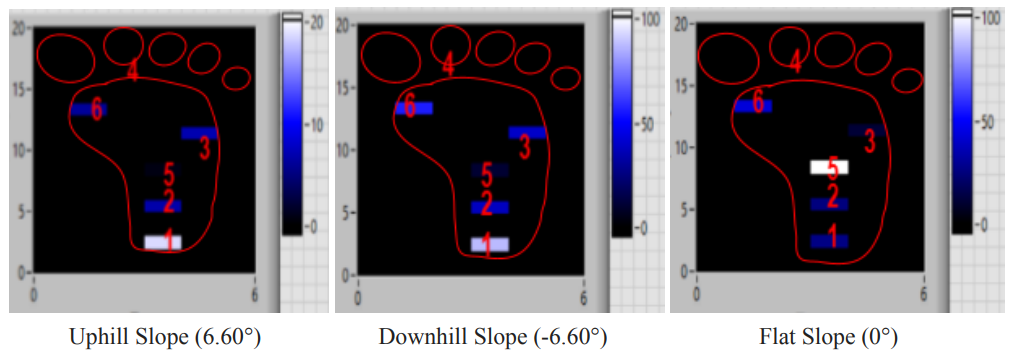
Our main takeaway: shoes with more arch support would probably help spread that pressure out more evenly, especially on a slope. Next steps if I kept working on it would be better sensor calibration, testing more incline angles, and moving from standing still to actually walking.
The full final paper, with methodology, sensor calibration data, and results, is below:
Open the full ME70 final paper